


Guest Post by Steve Remias, Head of Product Strategy, Signal Analytics at INRIX
As we close out another year, I want to look back at all the progress we have made towards our mission of providing intelligent mobility solutions to the public sector.
Introduced in 2020, Signal Analytics provides the industry’s first scalable cloud-based application that leverages connected vehicle information to help engineers and agencies identify and measure the performance of signalized intersections and corridors. Signal Analytics is currently live on over 10,000 traffic signals in the United States. Traffic signals are an important part of our overall transportation infrastructure and play a crucial role in keeping our roads safe and efficient for all users. In 2022, the Signal Analytics product received a major upgrade, with a host of new features that make it even more powerful and effective at managing traffic flow and measuring agency objectives.
One of the most notable new features is the reduction in the time when reports are delivered. Signal Reports are now delivered the next day. With this feature, traffic managers are provided with timely information that can be used to take immediate action. By using next day data, individuals and organizations can stay informed and stay ahead of potential problems. These problems include broken detection, traffic demand changes, and poor signal timings.
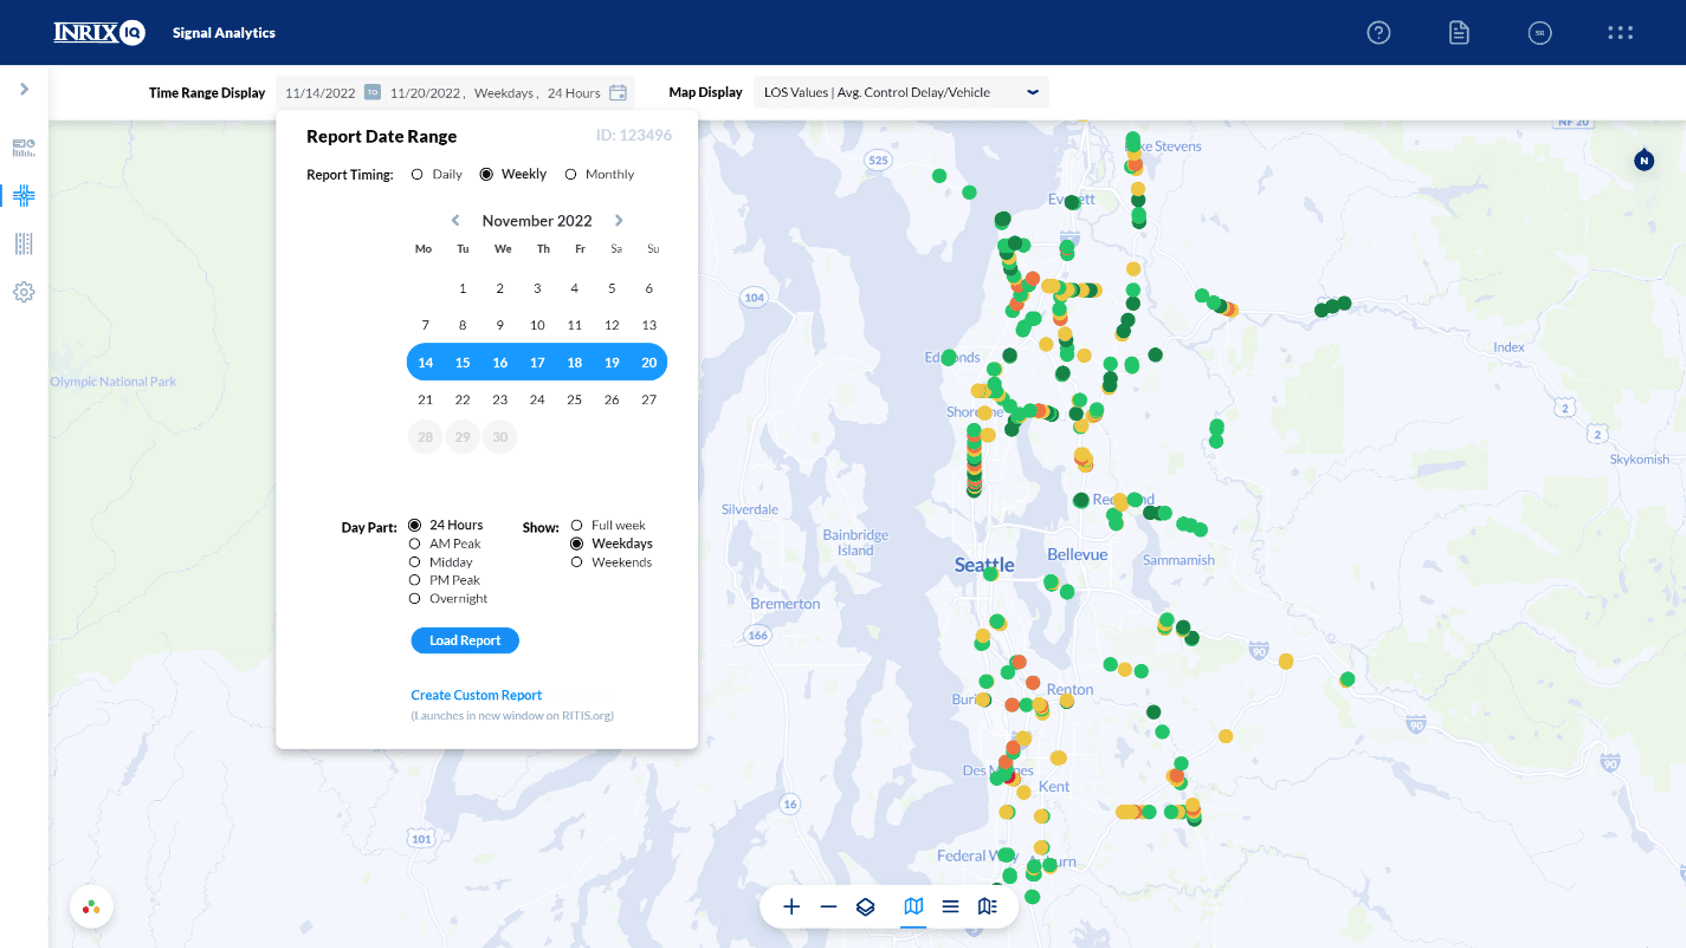
Weekly and monthly intersection reports were also introduced, providing a regular and structured way of summarizing and analyzing data over a longer period of time. This allows individuals and organizations to track trends and patterns, identify areas for improvement, and make decisions with more vehicle observations.
Weekly/Monthly Reporting Available in Signal Analytics
Our team also made significant improvements to our corridor selection process. Now with a few clicks, you can monitor the travel times along user defined corridors, without the need for the installation and maintenance of any field equipment. If the corridor is not collecting the data that was expected, it can simply be edited with no field visit.
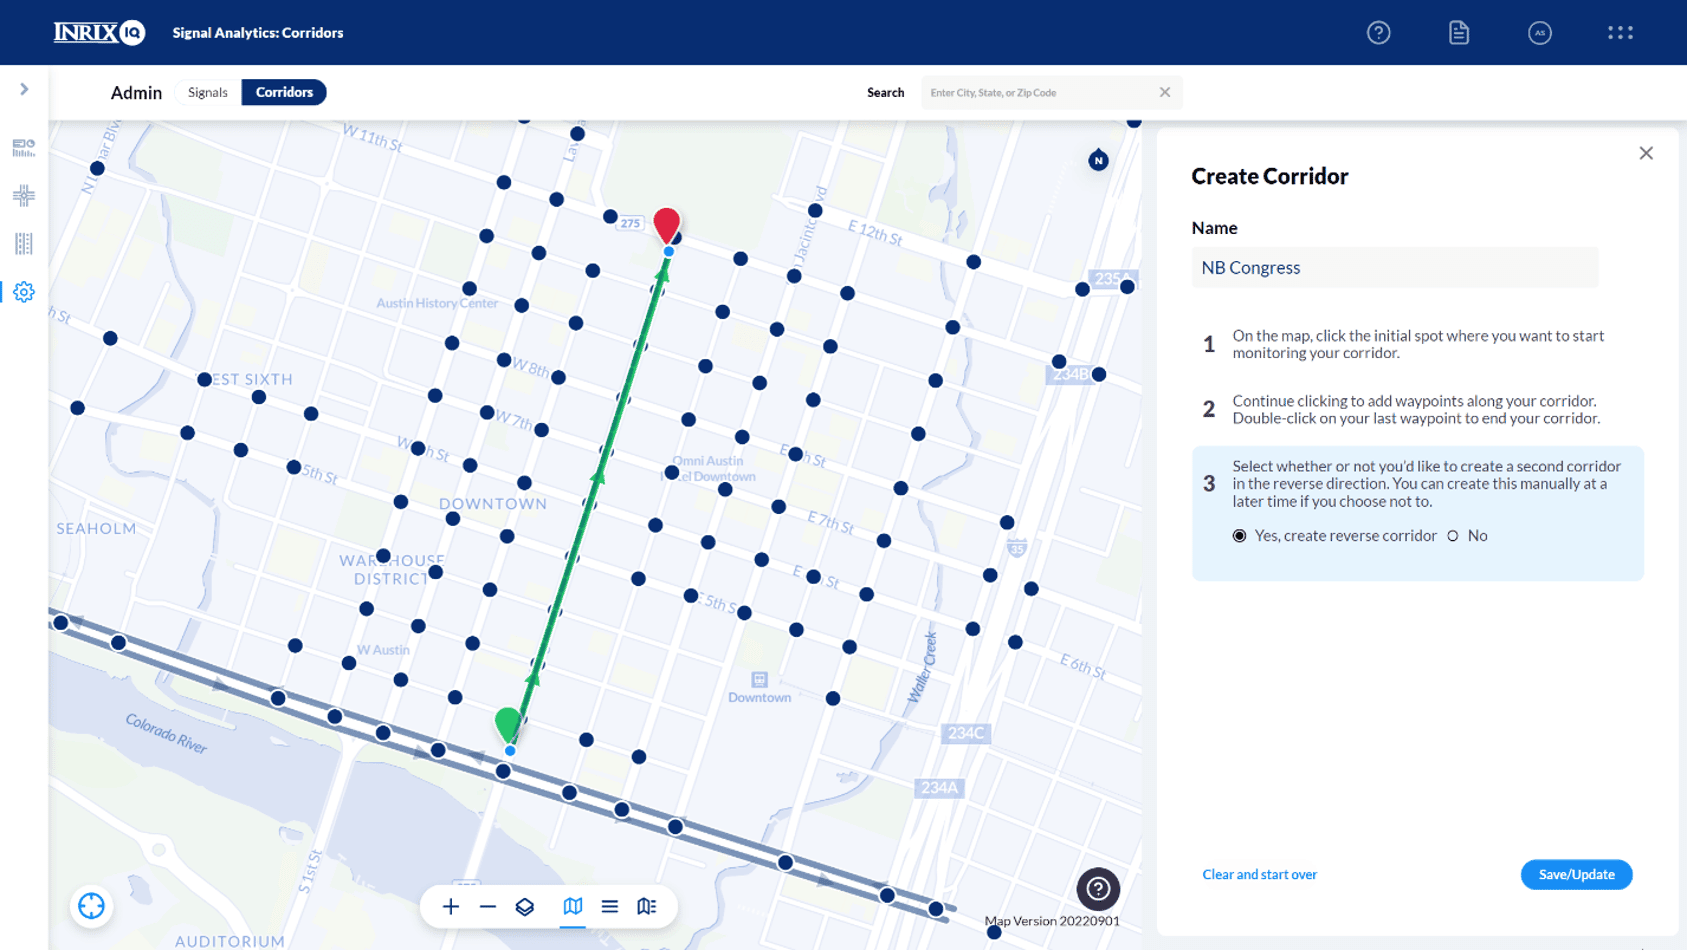
Corridor Selection Improvements in Signal Analytics
Another major enhancement to the Signal Analytics product was the addition of trajectory plots. Foundational to the field of transportation engineering, these figures allow engineers to investigate specific periods and gain insights about how individual vehicles are experiencing an intersection. They can be used to identify progression issues, highlight times when split failures may be occurring, and visualize traffic flow for reports and presentations.
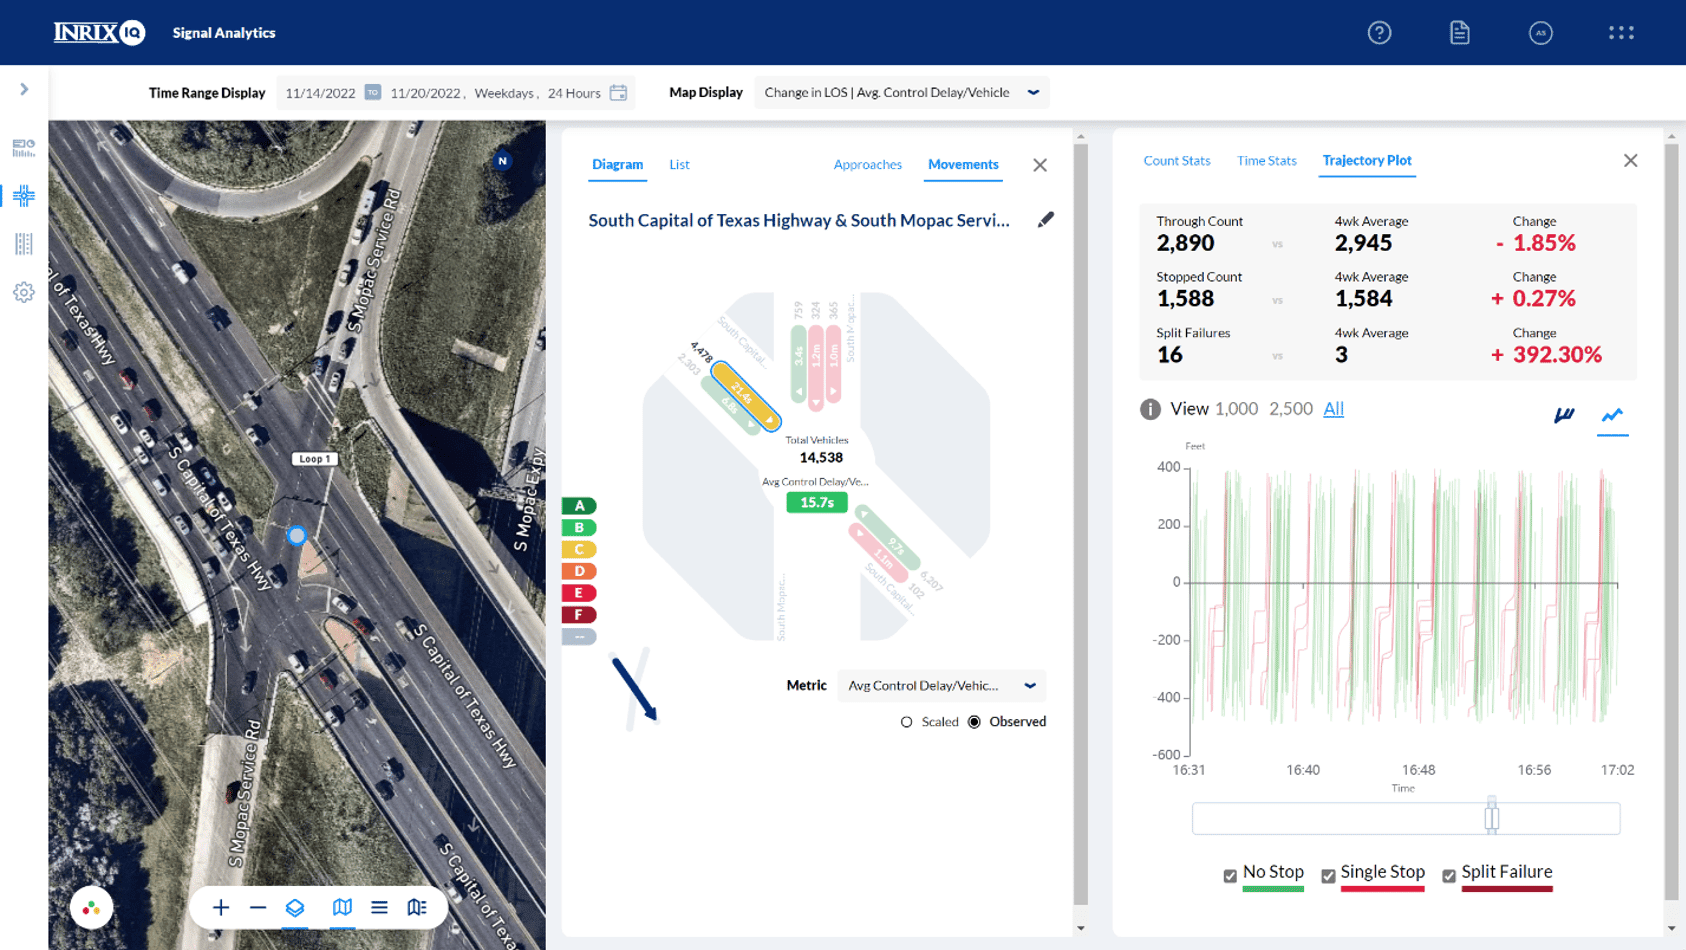
Intersection Trajectory Plots in Signal Analytics
Overall, the updates to Signal Analytics in 2022 make it an even more valuable tool for traffic managers, helping them to make better decisions and improve the safety and efficiency of our roads and intersections. We look forward to gathering more feedback from a growing community of traffic professionals in 2023, as we take billions of data points and turn them into meaningful insights for agencies to meet their objectives.
If you want to hear more about Signal Analytics and these new improvements please join us Thursday, December 15th at 1 PM ET, for a free webinar.
Want a personalized Signal Analytics demo? Request a virtual demo or book an in-person meeting at TRB (Booth #621).
Also feel free to email Signals@INRIX.com if you have specific questions.