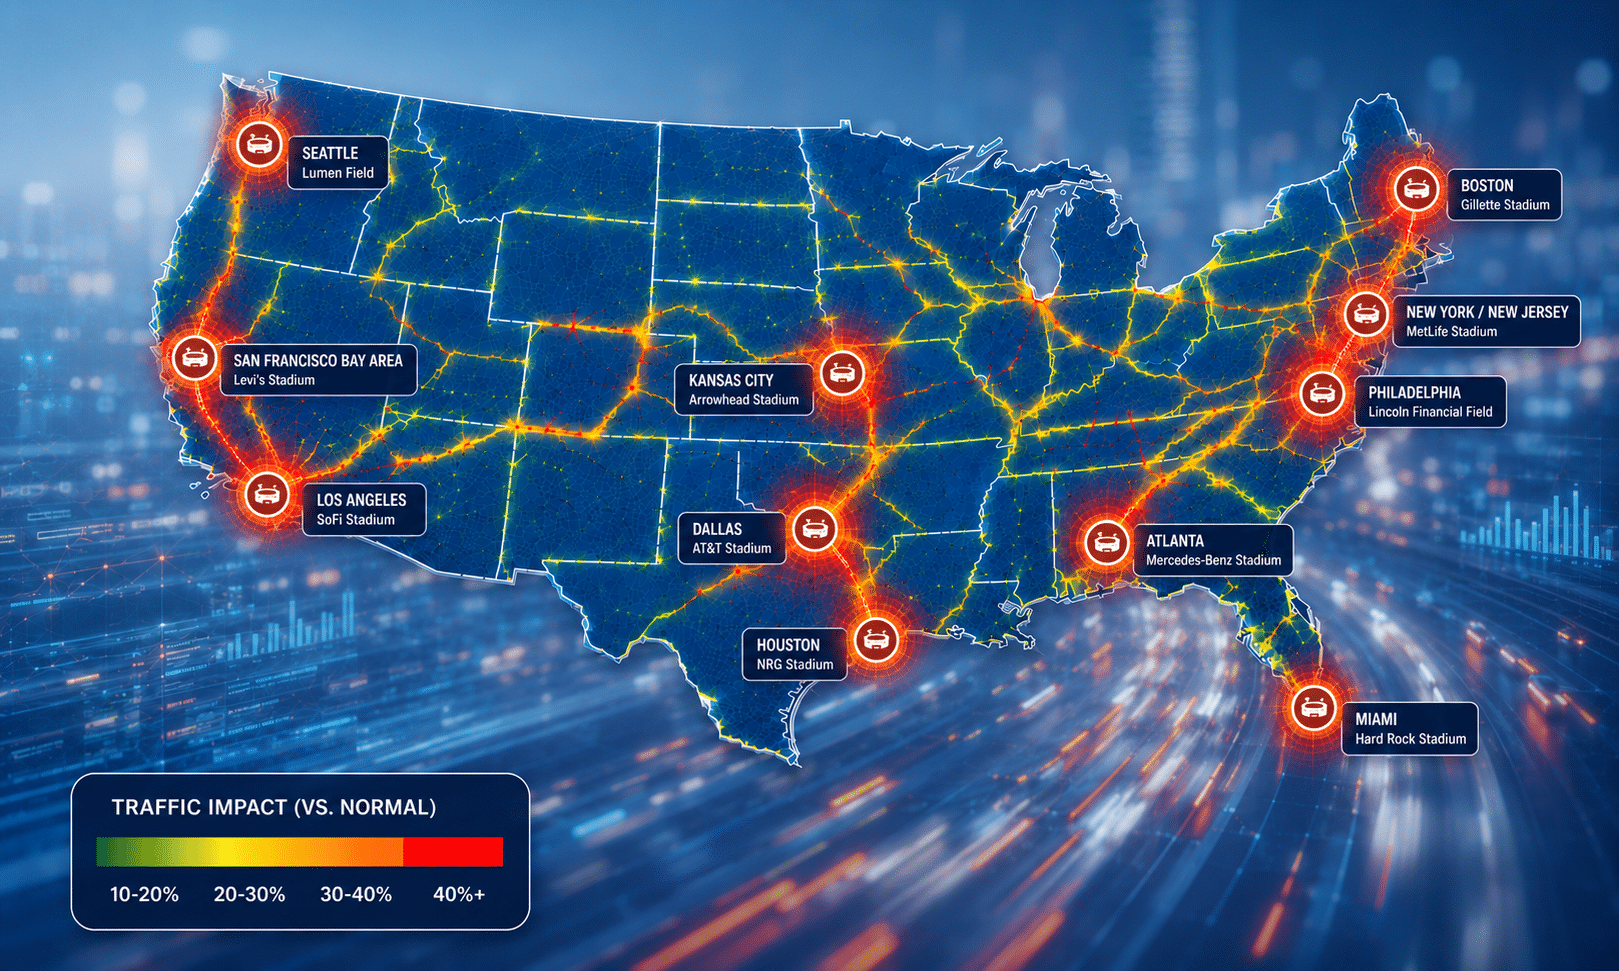


The 2026 FIFA World Cup is coming to 11 U.S. stadiums between mid-June and mid-July 2026. Cities around these stadiums have prepared for traffic disruptions during the events, ensuring cars, freight, transit, and walking/cycling facilities are able to accommodate the increase in visitors to the stadiums.
INRIX looked at historical data of major events at each of the 11 U.S. stadiums to provide a preview of what travelers should expect on their way to the stadium during the first day of World Cup events in their respective cities.
Around many cities, there will likely be a minimal effect on traffic, as many stadiums:
- Are outside of the city core and located in more rural areas
- See traffic demand dissipate in anticipation of upcoming congestion and mode shifts to transit and other modes
- Adequately ensure traffic congestion is managed and incidents are cleared on the roadways promptly.
- Have events planned for weekend or off peak times (early afternoon or late evening) where traffic congestion is less of a factor.
Though this traffic report discusses potential event-related congestion by stadiums, many cities associated with those stadiums (e.g. San Francisco and Levi’s Stadium) may see inner-city congestion build as travelers rent rooms, visit city sites, and explore nightlife downtown. This report should not be taken as a forecasting of inner-city congestion unless stadiums are within the five-mile distance of downtown areas.
Additionally, this report notes bottleneck locations on key roadways that have seen traffic jams in the past during large events, and provides estimates on the game-day travel times should travelers fly into nearby airports on gameday.
Traffic Delay Around Stadiums
INRIX analyzed the road network around stadiums by distance, comparing recent large events at each stadium and its effect on the road network. INRIX analyzed traffic conditions before and after events at a similar time and date to the upcoming FIFA World Cup matches at those stadiums.
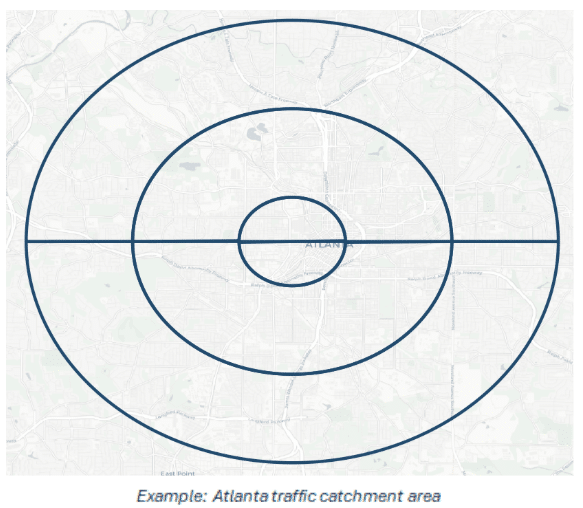
- 0-1 mile radius;
- 1-3 mile radius;
- 3-5 mile radius;
The delay experienced before and after an event was analyzed against both typical traffic conditions for that day, and event-related traffic, to provide insight into what can be expected at the World Cup events. In addition, traffic was analyzed in the hours prior to event kick-off as well as hours after the event officially ended.
Noted, it’s likely that these are conservative estimates given the size and scope of World Cup Events.
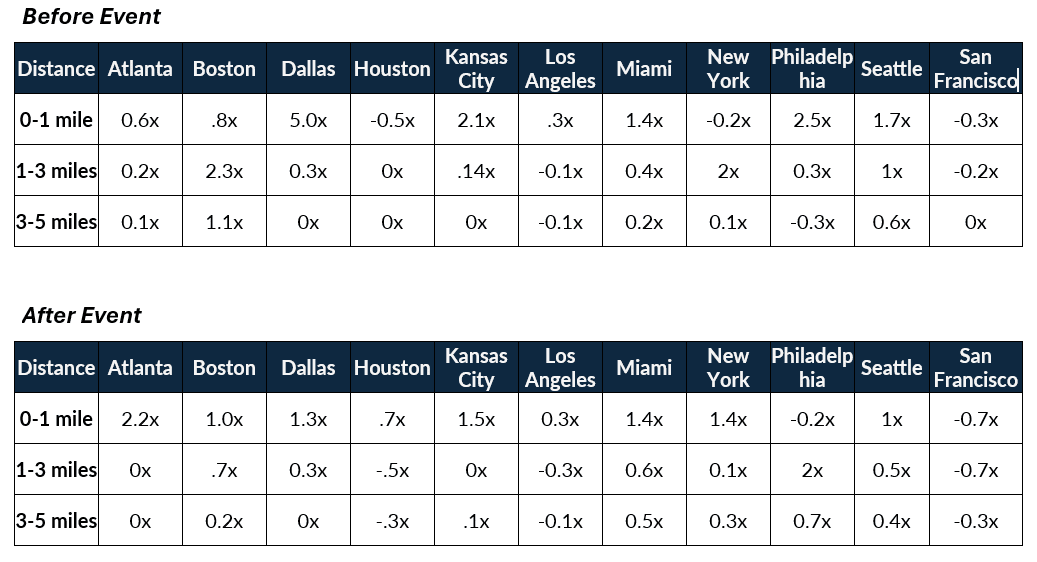
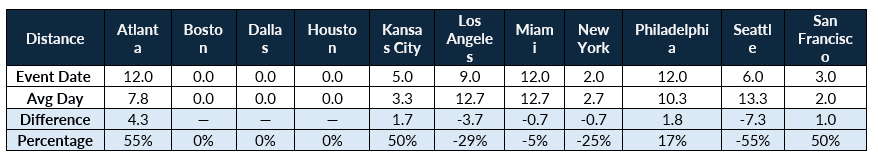
Event-Related Traffic Delay for Day 1
Depending on the location of the stadium and the day of week and time of day, traffic can bottleneck even under normal conditions without an event. Yet an event can add additional strain to the road network in addition to normal, recurring congestion. For example, if a road segment typically experiences 10 minutes of delay, but during an event saw 15 minutes of delay, delay has increased 50%, or 0.5x.
Below are the “event effects” of each location, the additional delay brought on by hosting an event on the day and time similar to the first game of the 2026 FIFA World Cup.
A negative delay amount may be due to having less traffic delay than normal during an event. This can occur if commuters and other travelers on the road shift modes, work from home, or stay off the road during that time to avoid traffic.
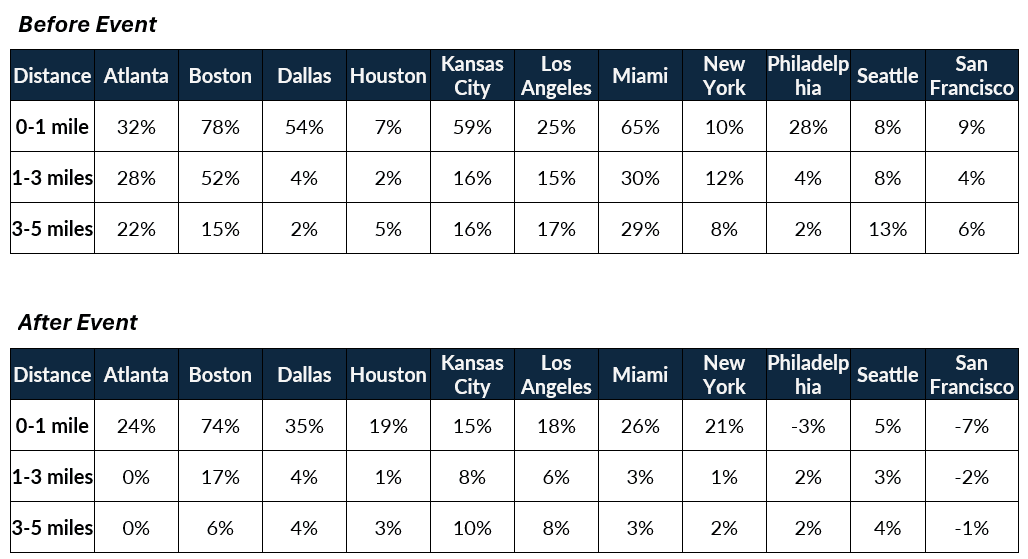
Travel Time Estimates
Unsurprisingly, travel times are expected to increase the most within one mile of the stadium prior to and post event. Many areas surrounding the stadium, especially around dense urban centers may continue to see traffic congestion pre- and-post event as traffic concentrates and disperses along the road network.
This metric is good to estimate travel times when traveling to the stadium. For example, within one mile of the stadium in Boston (Gillette Stadium – Foxborough) travelers can expect the trip to take 67% longer than it would without traffic.
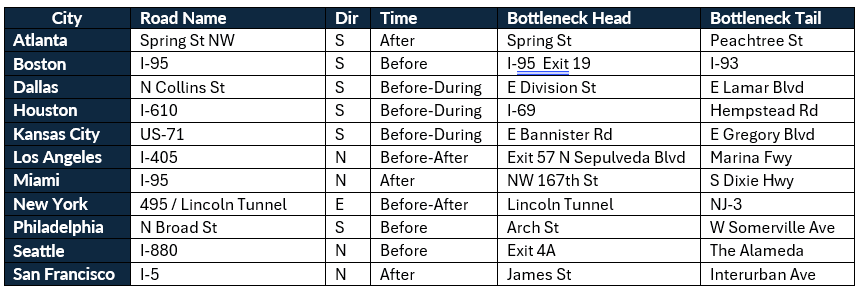
Event Traffic Bottlenecks
INRIX used Roadway Analytics to scan event dates for traffic bottlenecks, with the top bottlenecks located within the five-mile radius of each stadium, are listed below. Each bottleneck has different severities, including duration (time), occurrences (number of traffic jams), and queue length.
These traffic hotspots around stadiums may be some of the most-congested corridors near stadiums and may benefit from extra attention to clear incidents during gameday.
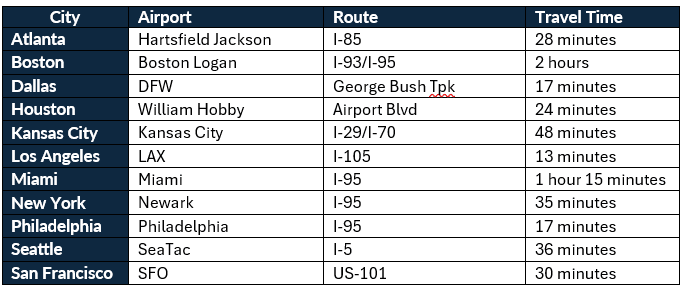
Airport Travel Times
INRIX analyzed direct trips from nearby and popular airports to the stadium for travelers arriving on Gameday. These travel times were calculated on the most-popular route to the stadium and are based on previous events which often saw record-breaking attendance at the stadium. It’s likely these travel times are to be conservative in regards to the World Cup given the amount of travelers into the area.
Traffic Incidents
INRIX analyzed traffic incidents using a recent event date which saw record breaking attendance to the stadium. Often, concerts (Taylor Swift Era’s Tour, Metallica Tour) or sporting events (past World Cup events, NFL playoff games, etc) were used as a baseline. It was then compared to the typical day of week the first game is to be played on (e.g. if Game 1 is on a Sunday, the event date analyzed was also on a weekend and the average day was calculated on previous Sundays).
For more information on the World Cup traffic read more here.