
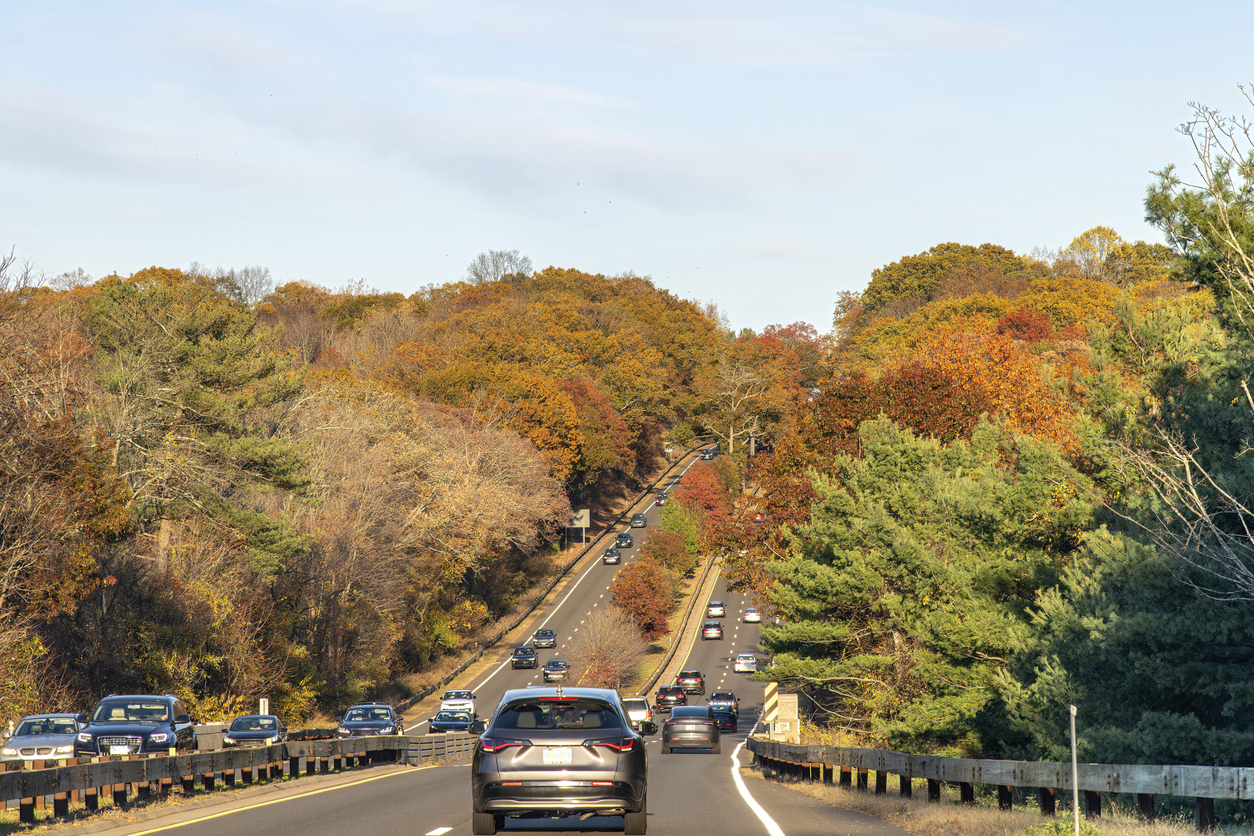


Fall brings cooler temperatures, changing leaves, the return of school routines; it gets darker sooner, which brings new challenges on the roads.
As daylight hours shrink and Halloween approaches, more everyday trips take place in darkness or low-light conditions. Students travel to and from school; commuters head home after sunset, and on Halloween night, neighborhoods see increased pedestrian activity as families and trick-or-treaters take are on the streets.
For cities and transportation agencies, these seasonal changes raise an important question: Do we know where vulnerable road users are and what conditions they face after dark?
Data-driven insights can help agencies better understand these changing conditions, identify areas of risk, prioritize interventions, and measure whether safety improvements are working.
How Darkness Changes the Safety Equation
Research presented during the INRIX webinar, Navigating Fall Roadway Safety, highlighted the disproportionate risk pedestrians face at night. A three-year NCHRP research project found that the majority of pedestrian fatalities occur during dark or low-light conditions and that increases in pedestrian deaths over recent decades have been driven largely by nighttime fatalities.
Visibility is part of the problem, but it isn’t the only factor.
Researchers found that drivers take longer to recognize pedestrians in darkness. Speed can make those conditions even more dangerous by increasing stopping distance and reducing the time available to react. In a driving simulator used as part of the research, pedestrian crashes occurred primarily on roads with speeds of 40 mph or higher, while none occurred on the 25 mph roads tested.
The fall transition can bring these risks into sharper focus. When Daylight Saving Time ends, trips that recently took place in daylight suddenly happen in darkness.
Halloween adds another challenge: increased pedestrian activity after dark, often on residential streets and at crossings where drivers may not normally expect large numbers of people walking.
Lighting Helps, But It Isn’t Enough
One of the webinar’s takeaways was that improving nighttime safety requires more than adding streetlights.
Research suggests agencies should think about three interconnected strategies: managing vehicle speeds, increasing driver awareness of pedestrians, and reducing pedestrian exposure in the roadway.
That can mean combining appropriate lighting with high-visibility crosswalks, rectangular rapid flashing beacons, pedestrian hybrid beacons, traffic-calming measures, curb extensions, crossing islands, sidewalks, and other treatments.
The key is matching countermeasures to roadway conditions rather than relying on a single solution. On a higher-speed roadway, for example, better markings alone may not be enough. Agencies may need to layer treatments that improve visibility while also reducing speeds and pedestrian exposure.
Finding Risk Before an Incident Happens
The next challenge is knowing where to act.
Schools, transit stops, grocery stores, commercial districts, entertainment areas, and residential neighborhoods naturally generate pedestrian activity. During fall, agencies should pay particular attention to locations where that activity overlaps with darkness, higher speeds, and significant vehicle volumes.
That’s where transportation data can help.
INRIX Speed Distribution Profiles can help agencies understand speed distributions across roadways and at different times of day. During the webinar, a Seattle school-zone example demonstrated how speed patterns could be examined throughout the day including changes during periods when enforcement was active.
INRIX’s Vulnerable Road User Index can also help identify roads with greater pedestrian and bicyclist activity. When those insights are combined with traffic volumes, vehicle speeds, and time-of-day data, agencies can develop a more complete picture of exposure and potential risk.
For fall safety planning, that means agencies can start asking more targeted questions:
- Where do high speeds overlap with pedestrian activity after sunset?
- Which school zones experience speeding during arrival and dismissal?
- Where will Halloween bring more people into the roadway after dark?
- Which corridors should be prioritized for safety improvements?
Turning Insights into Action
Halloween, shorter days, school routines, and the end of Daylight-Saving Time make fall a natural time to focus on roadway safety. But the larger lesson extends throughout the year.
By bringing together speed, traffic volume, vulnerable road user activity, time of day, and roadway context, agencies can better identify where risks converge—and act before a serious crash occurs.
Learn how data-driven insights can help cities and agencies prepare for seasonal traffic shifts and safety challenges, creating safer streets this fall and beyond. Watch the Navigating Fall Roadway Safety webinar here.