Blog
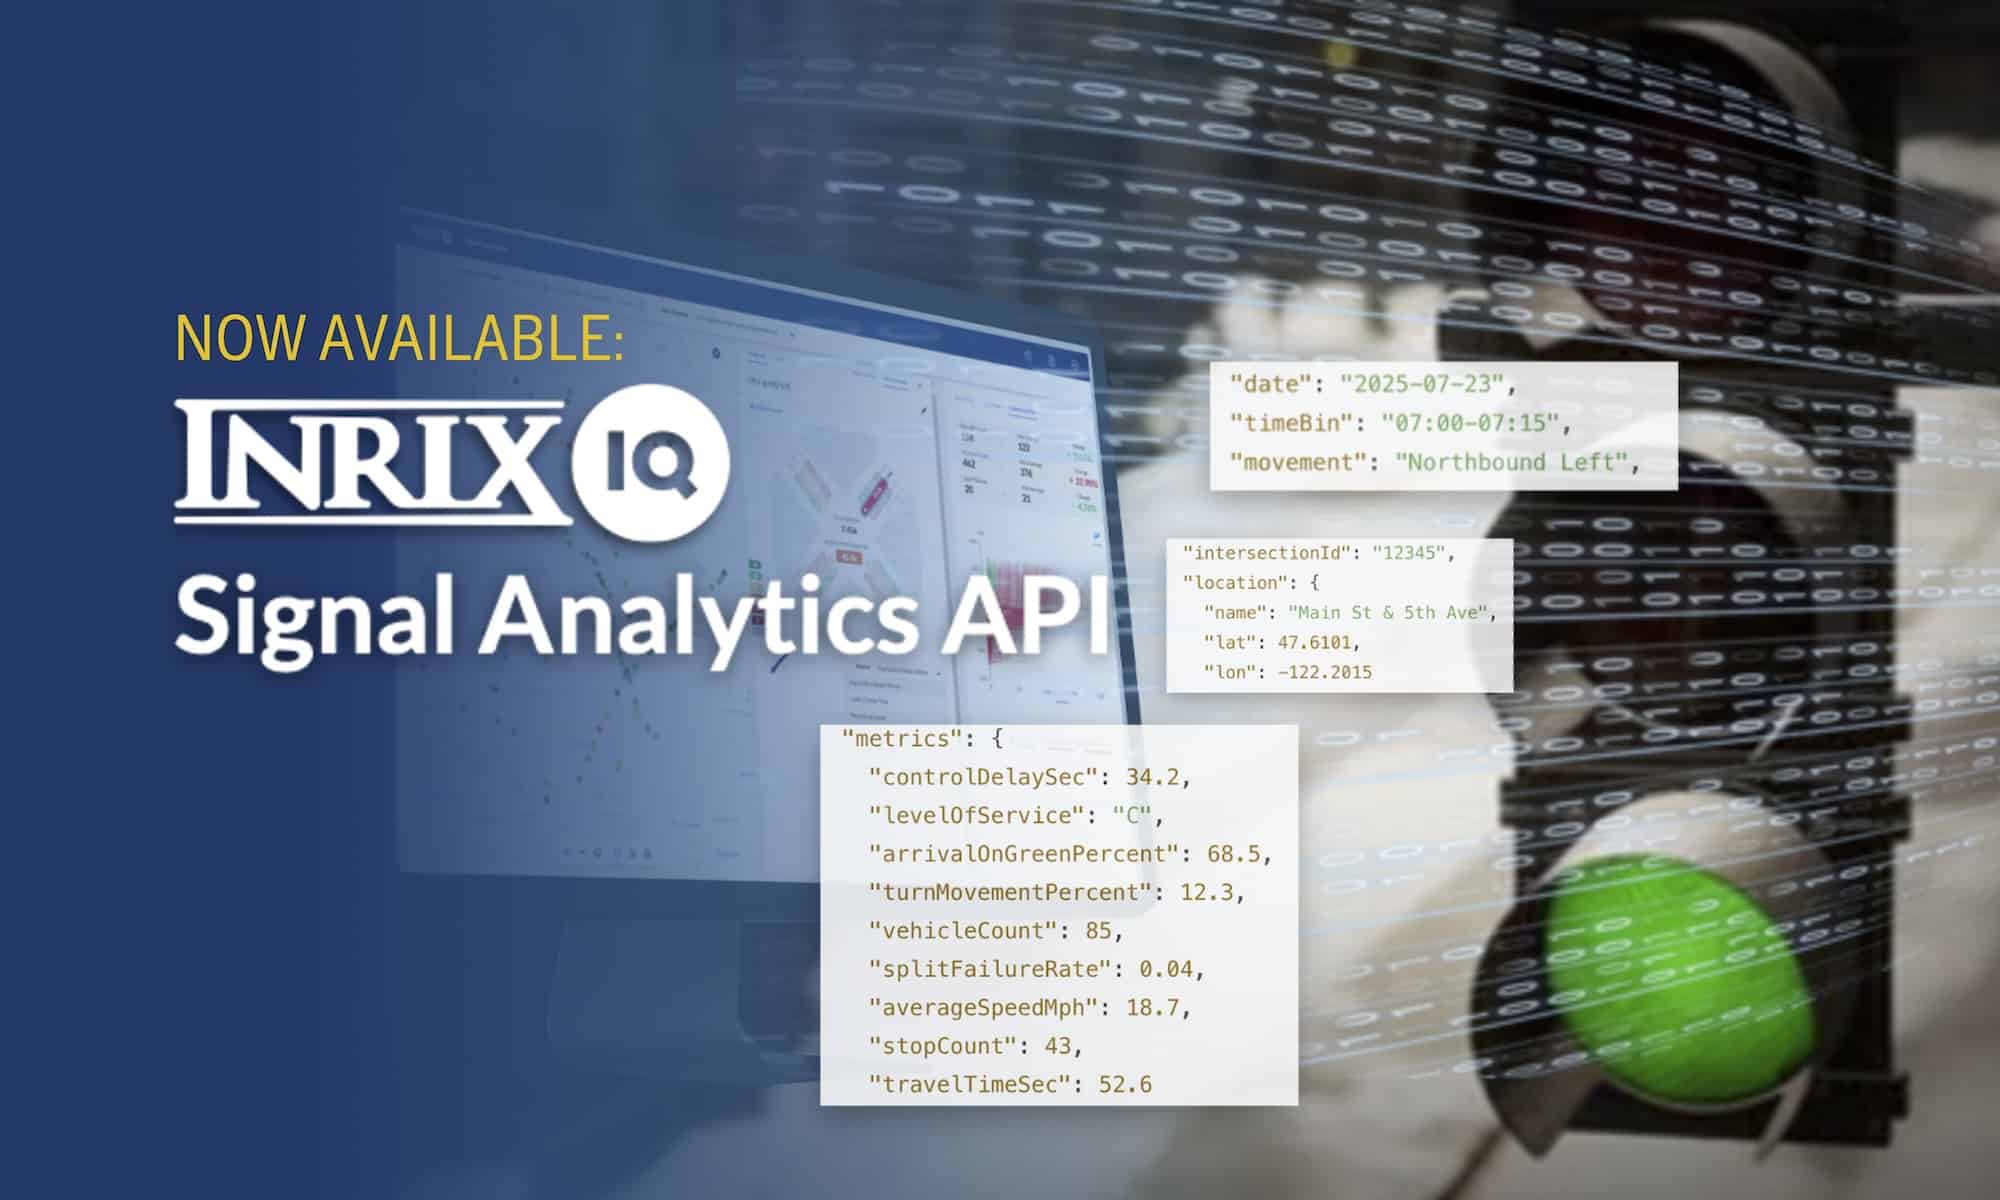
Introducing the new Signal Analytics API
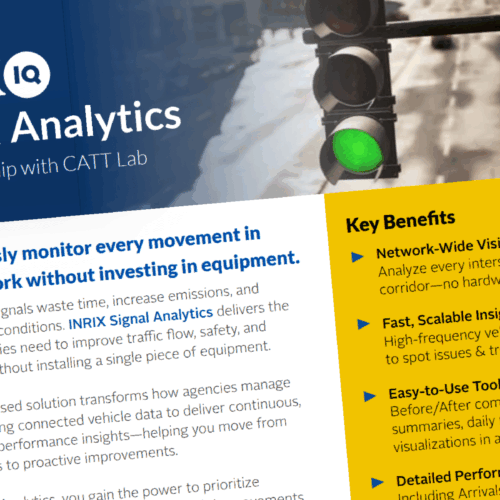
The Signal Analytics API delivers scalable, network-wide signal insights—no hardware or dashboards required.
Read Blog
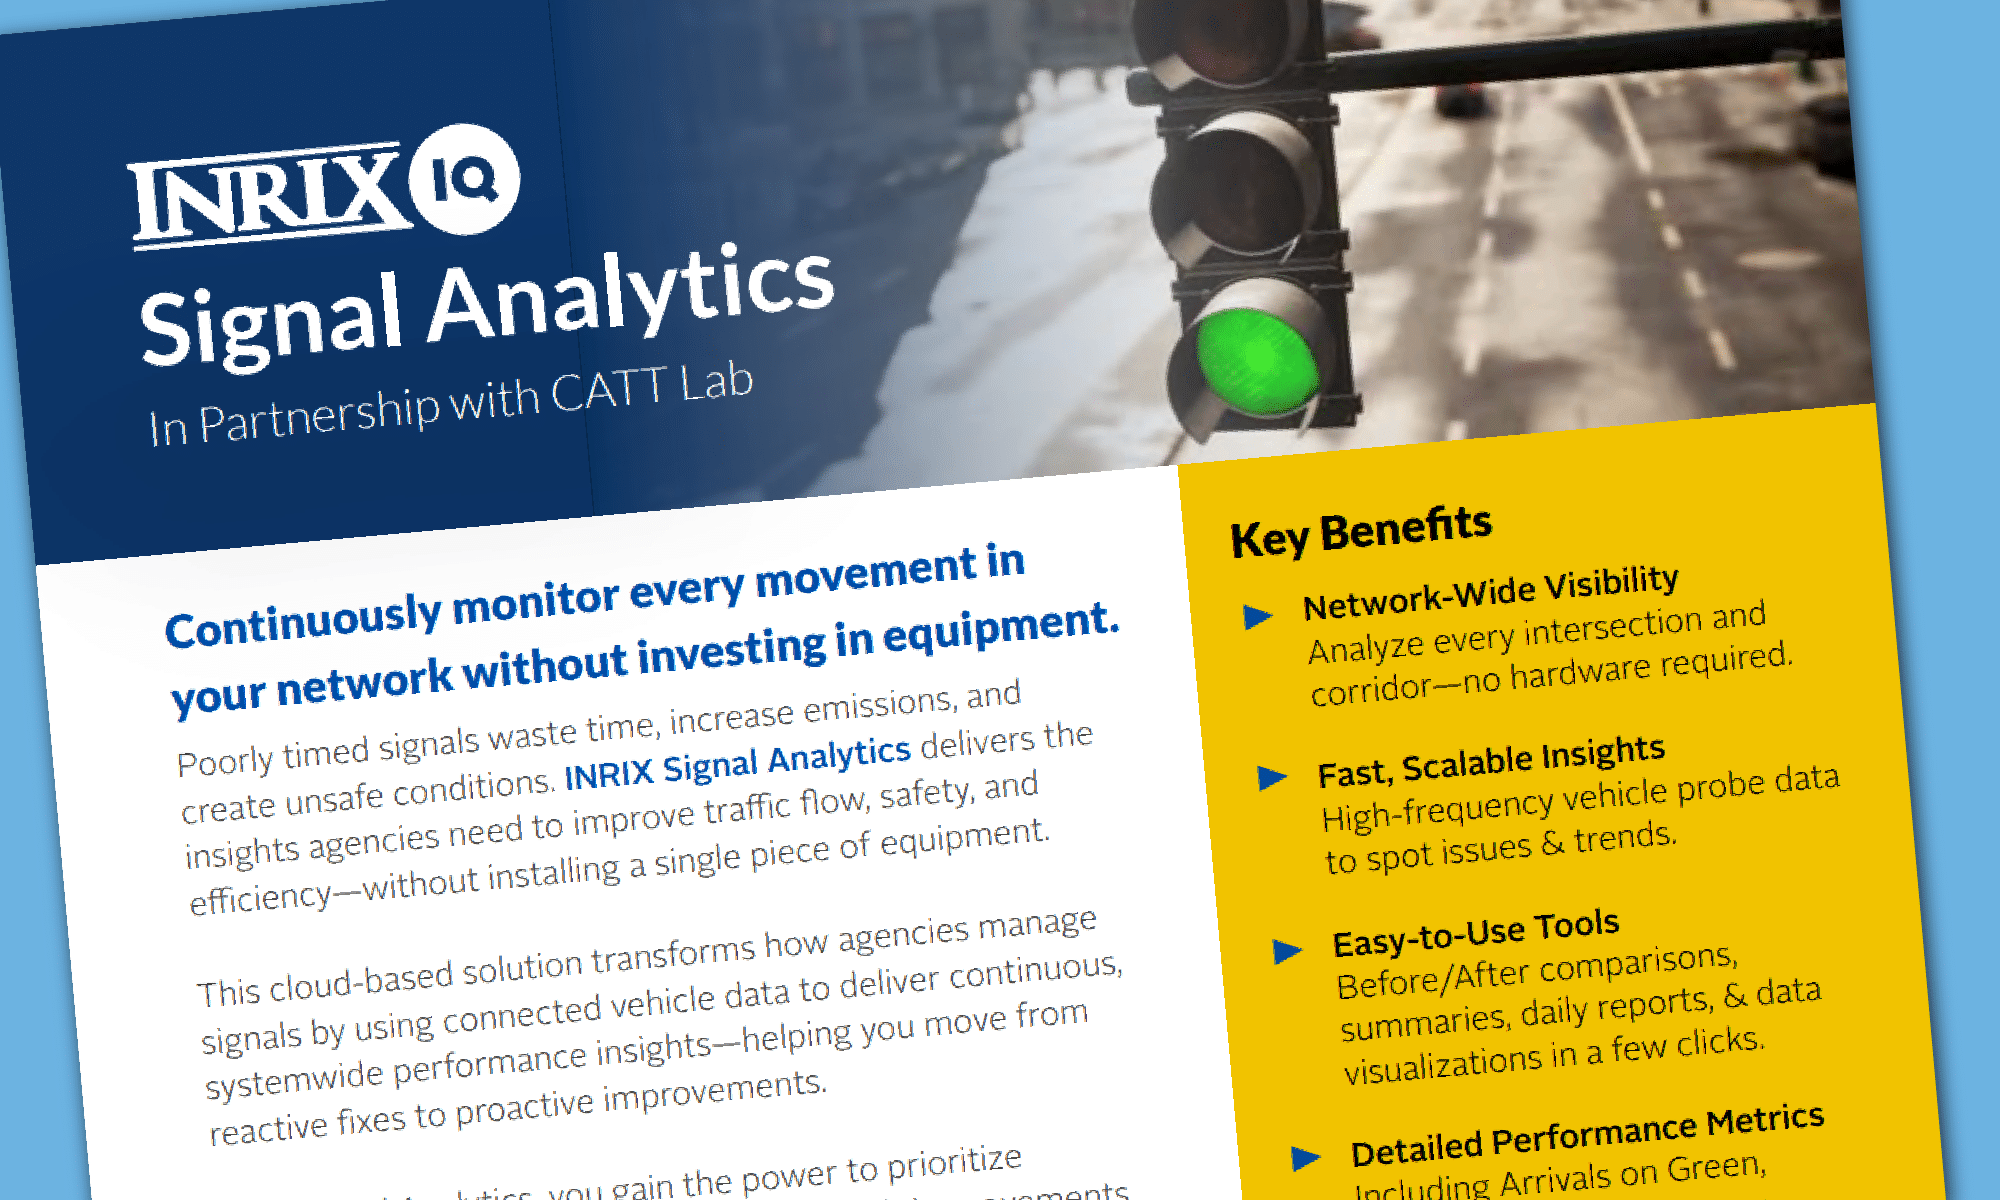
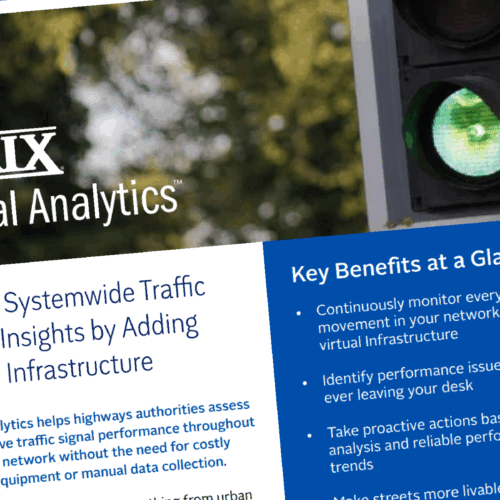
Access Systemwide Traffic Signal Insights
Without Investing in Equipment

The negative effects of a poorly timed traffic signal system can be frustrating for drivers, but also impacts urban congestion, pollution, and safety.
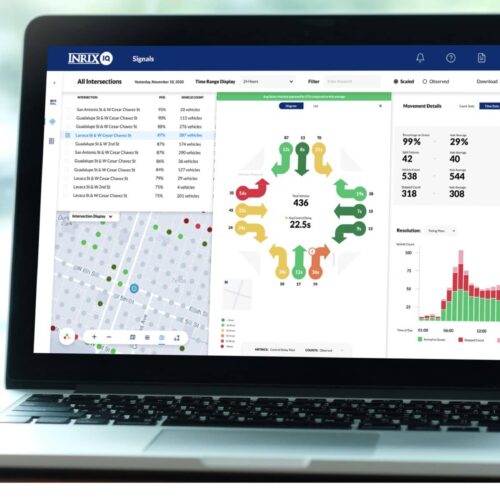
INRIX Signal Analytics is the first cloud-based application that uses big data from connected cars to help traffic professionals identify and understand unnecessary delay at signalized intersections areawide – no hardware or fieldwork required. Our traffic signal software provides valuable mobility insights to enhance urban traffic flow.
By transforming billions of data points into easy-to-understand summaries, charts, and data visualizations, Signal Analytics will help you quickly answer almost any intersection and corridor-related question you might have system-wide.
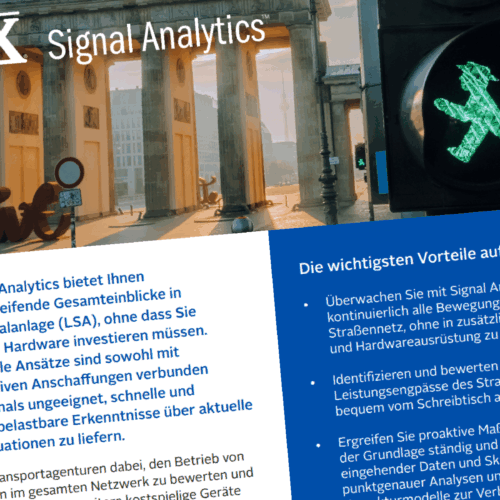
*Signal Analytics is available in the U.S., the UK, and Germany, with other countries to follow.
Signal Analytics creates a virtual infrastructure by continuously collecting connected car data across the entire network and provides accurate metrics for every movement and every intersection at a fraction of the cost of hardware-based solutions.
By transforming billions of data points into detailed and transparent metrics and trends, our traffic signal software helps agencies quickly answer almost any intersection- and corridor-related question to prioritize traffic signal projects and make meaningful improvements.
Whether you need to reduce delays for just a few signals or improve performance throughout your entire network, Signal Analytics provides functional summaries, detailed daily reports, and data visualizations at the click of a button so you can immediately take action rather than waiting for residents to complain.
Signal Analytics is powered by billions of anonymous data points generated from connected vehicles which results in significant cost savings for transportation agencies seeking traffic flow improvement.
![]()
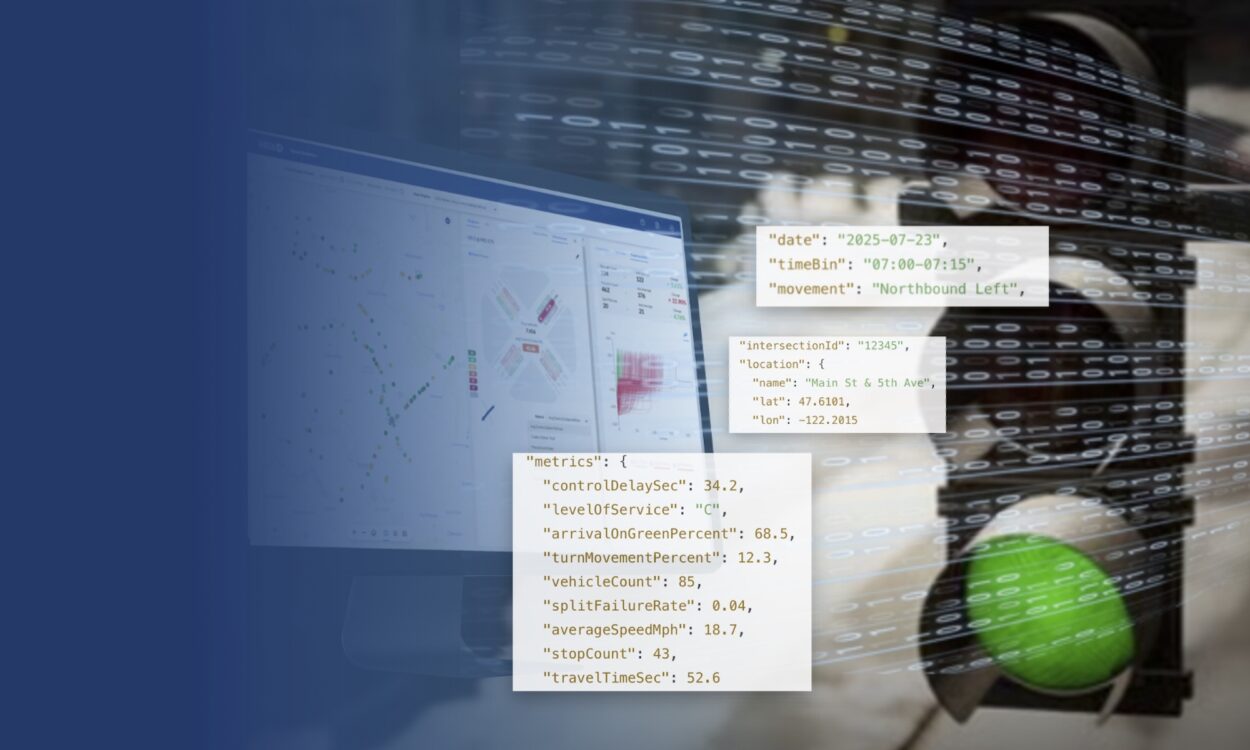
You can now bring our trusted network-wide performance insights into your own tools & dashboards with the Signal Analytics API.
Read the announcement or download the brochure below to learn more.
See the API Brochure

The percent of vehicles without a stop recorded at the intersection

The number of observed vehicles making right turns, left turns, and through movements at the intersection for a chosen time period

The distribution of travel time for each movement at each intersection approach

Visualize discrete vehicle paths for every approach or movement at any intersection

The extra time required at an intersection due to slowing attributed to the signal compared to measured free-flow speeds

The number of occurrences of a green light failing to meet vehicle volume demand, resulting in a vehicle stopping more than once at a traffic light (currently not available in the UK)

Signal Analytics empowers everyone from traffic engineers to maintenance technicians to identify and solve performance issues faster, smarter, and safer – all without ever leaving their desks.

Get a ranked, sortable measurement of intersection and corridor detail, performance trends, and high-importance notifications by day, week, or month.

Dig into the data with interactive tools and reports or just stay up to date on the latest trends across your light system with daily report summaries.
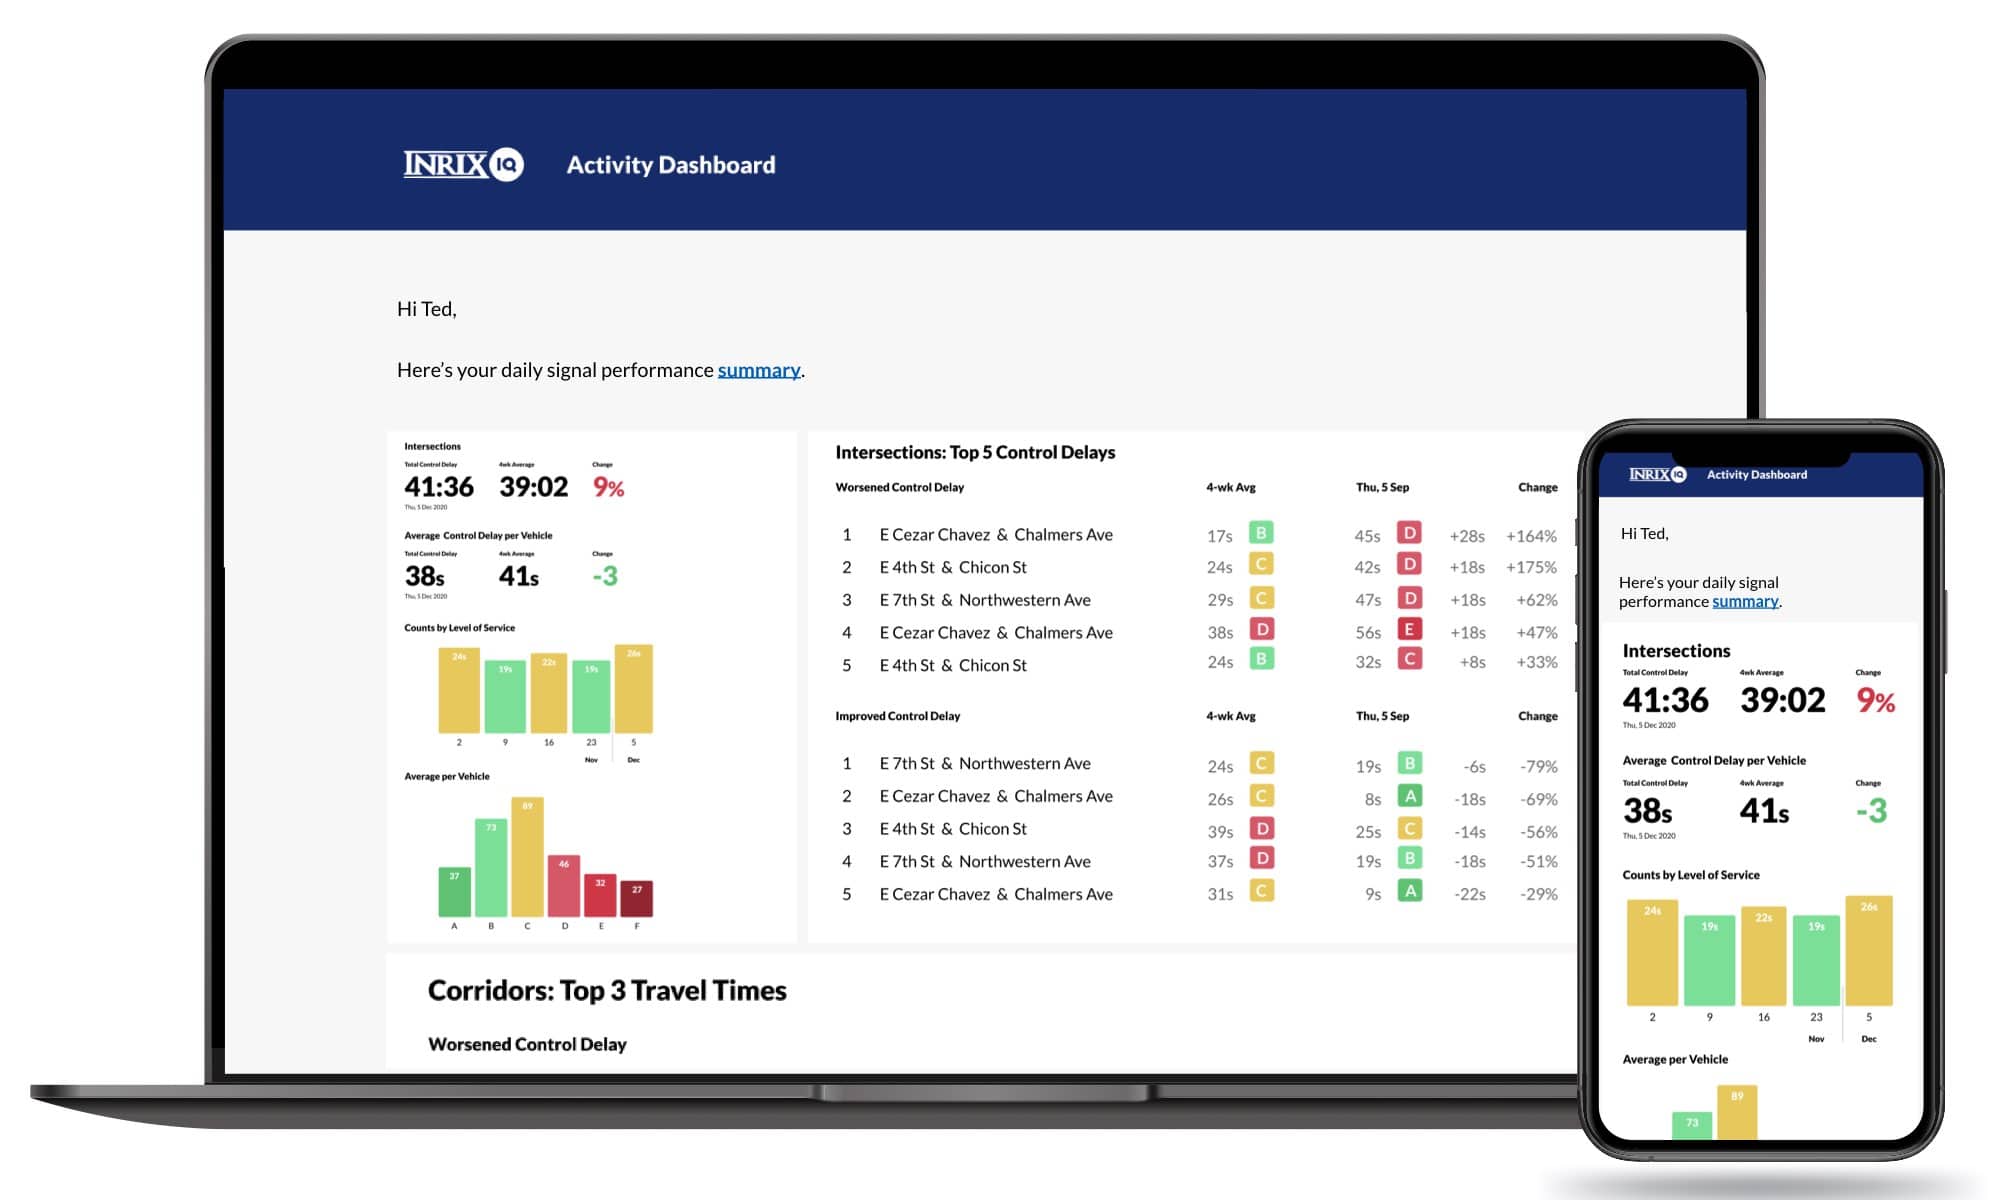
Customizable daily reports provide details on the subscribed intersections & corridors, highlighting key metrics, problems, and trends along with visual infographics.
*Where available

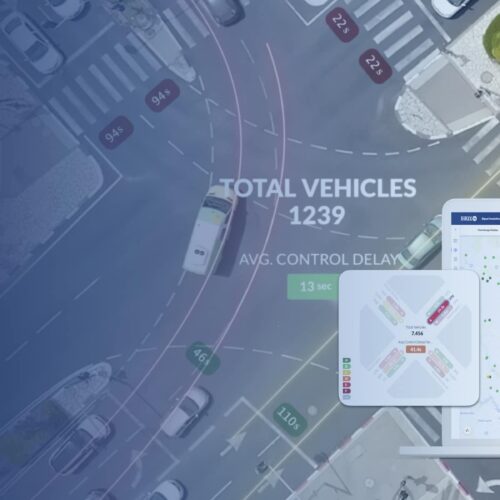
Easy-to-use dashboard includes every metric needed to understand intersection performance, including control delay, split failures, turn ratio, volume, trajectory plots, and more.
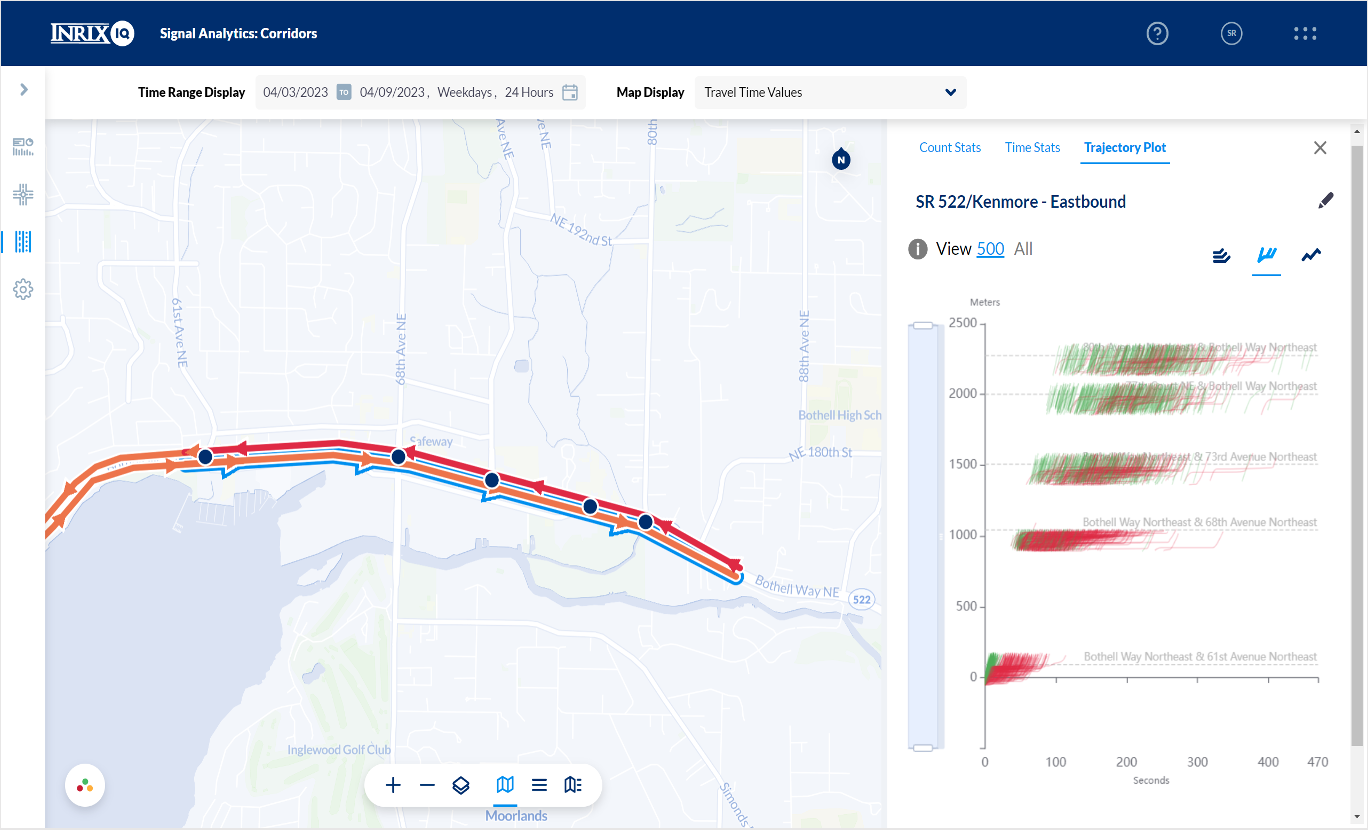
Understand and analyze the reliability and performance of defined corridors at various times of the day.

Select user defined time periods and regions to run in-depth custom reports

Custom visualizations to identify time of day and day of week opportunities

Movement-specific metrics to identify, rank and prioritize intersection signal projects, or conduct custom analysis
Signal Analytics is an intuitive and easy-to-use cloud-based application. No additional IT resources or data scientists are needed to gain insights.
After signing up online, we flip a switch to turn on your subscribed intersections and corridors so you can start exploring the data instantly.
By leveraging the portion of data from connected vehicles and devices, we are able to provide data on key metrics for virtually all intersections.
Dig deeper with a custom inspection of an intersection, such as running custom reports to determine periods when intersections are under performing or run before and after reports to determine if a problem was solved. (U.S. only)
Understand and analyze the reliability and performance of defined corridors at various times of the day, and answer important questions such as: What times of day is the corridor underperforming? How did the corridor handle traffic as a result of a special event/work zone?
Massive amounts of anonymous vehicles data capture every movement for every intersection and enable granular insights without relying on expensive hardware or fieldwork.
The Signal Analytics API delivers scalable, network-wide signal insights—no hardware or dashboards required.
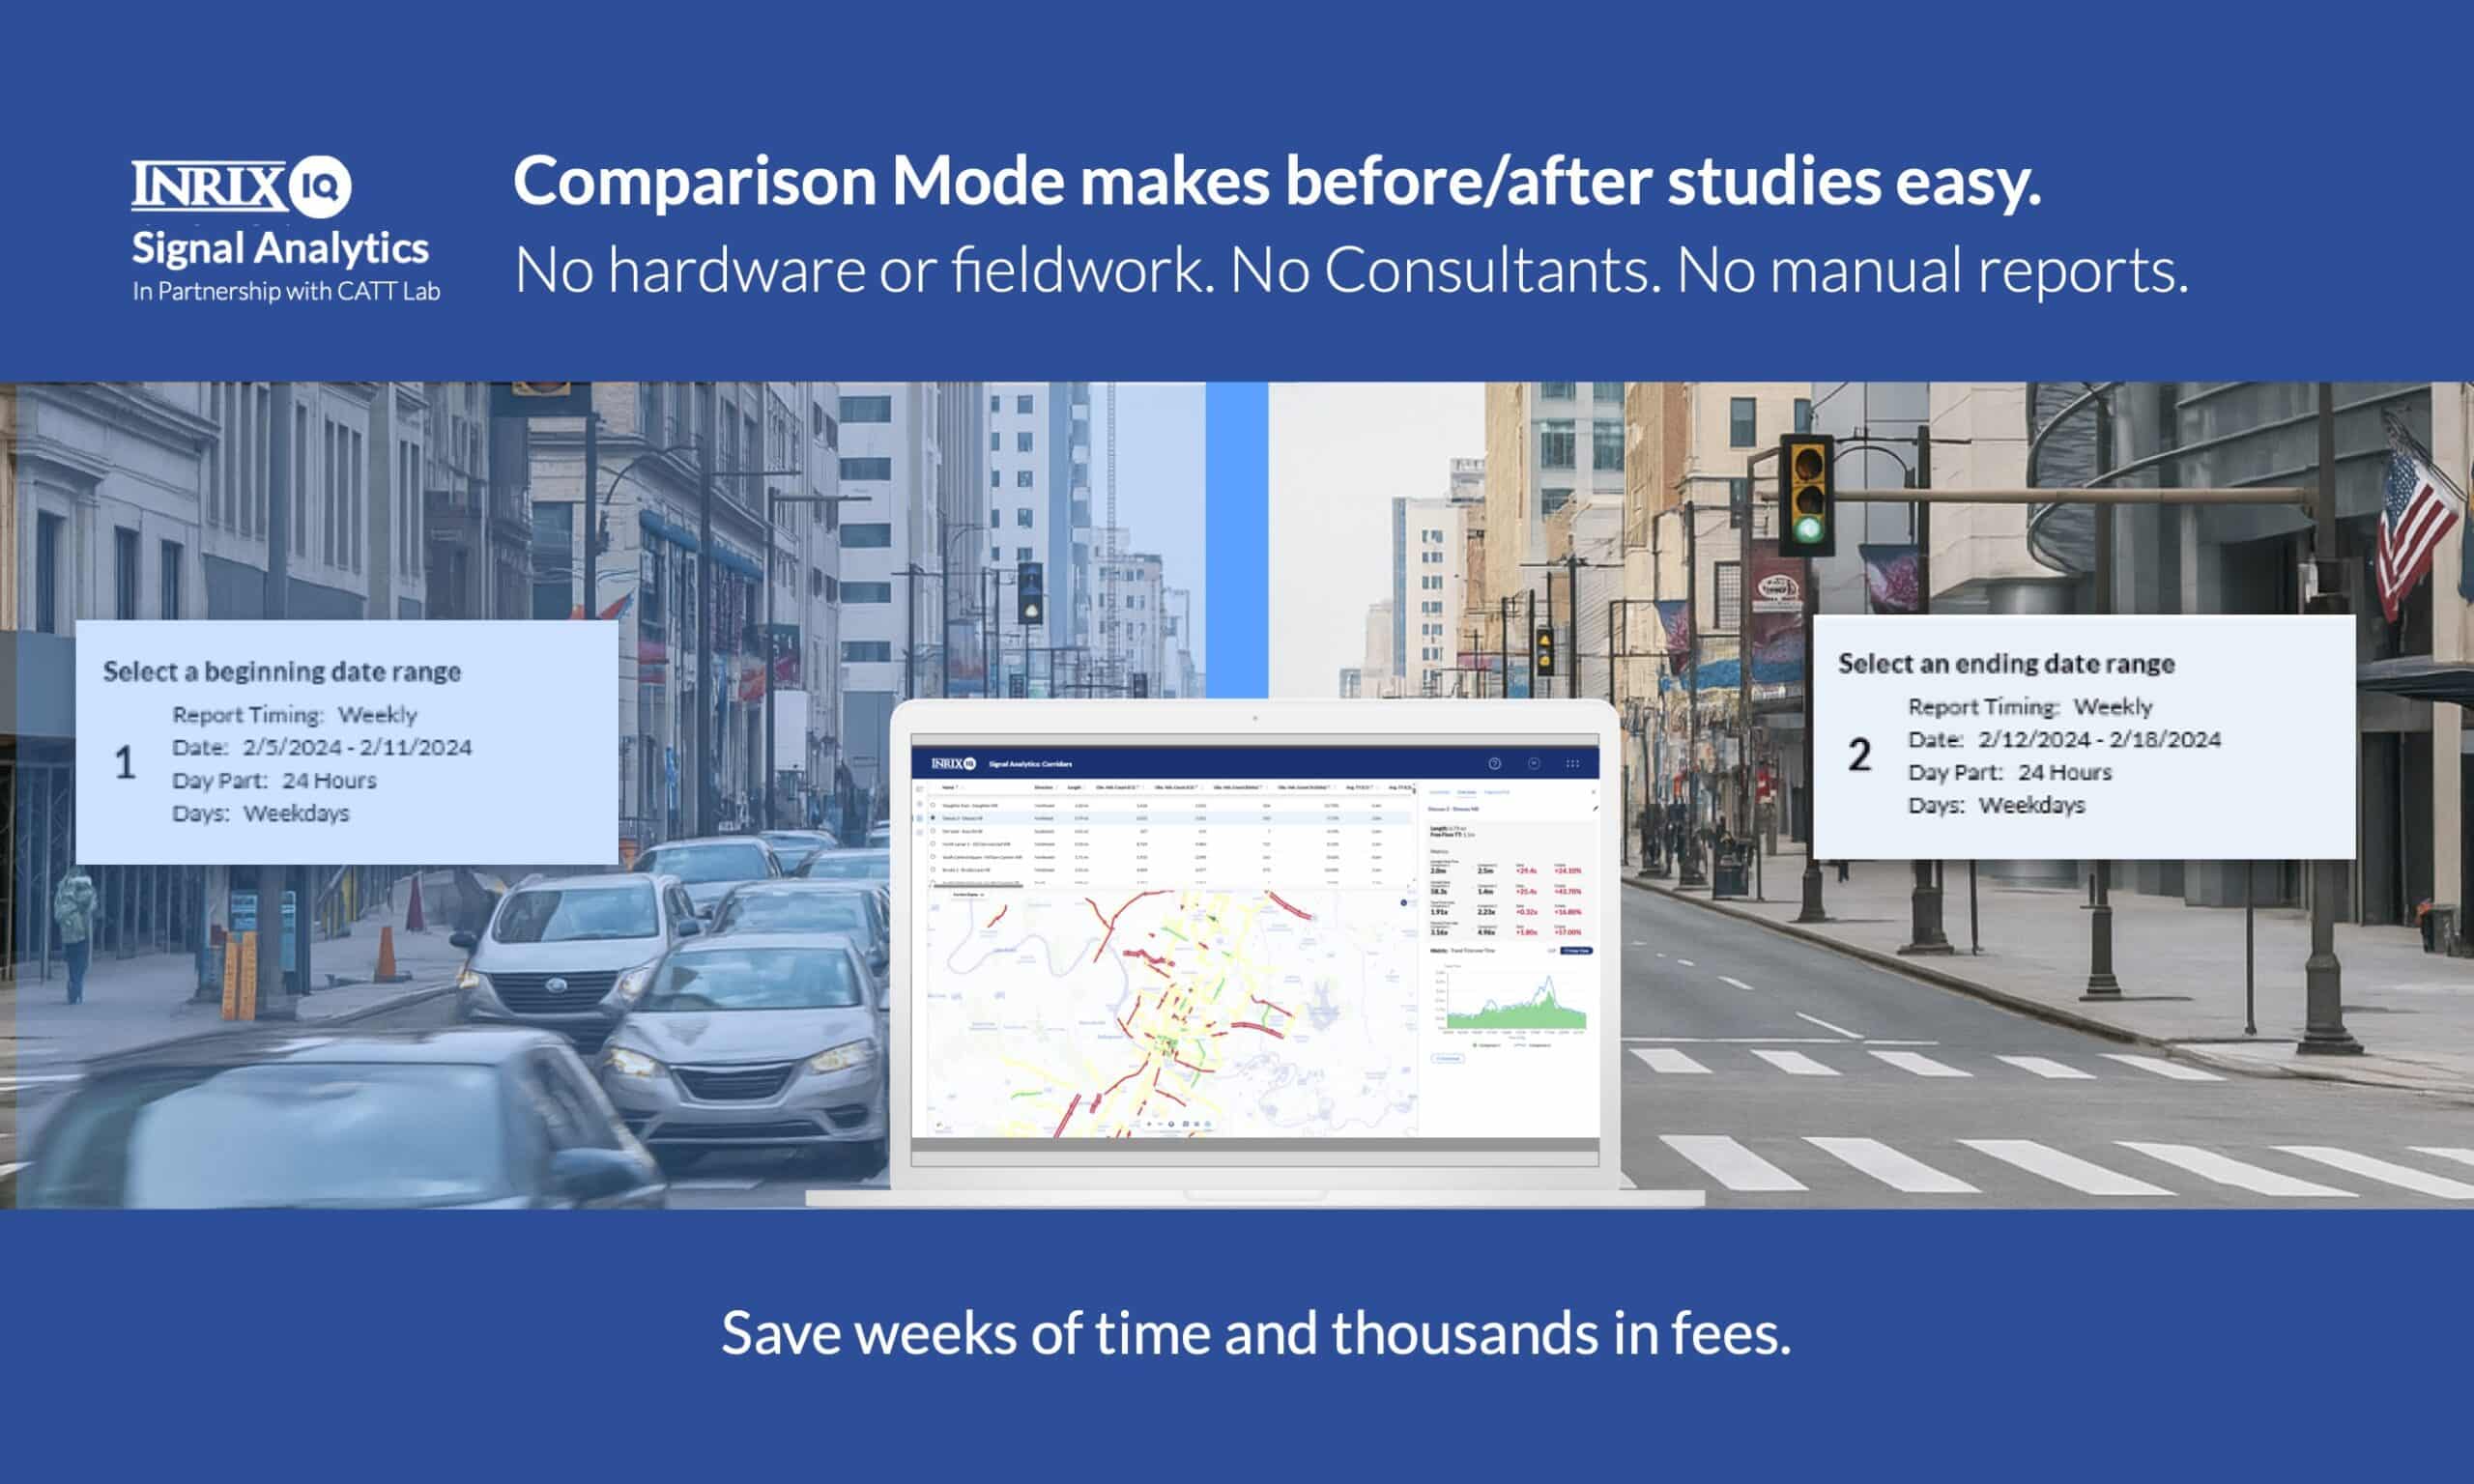
Read BlogThis new feature let's you compare any two periods—day-to-day, week-to-week, season-to-season, or year-over-year—to understand impacts at any scale.
Read BlogSaaS-based platform available for 250,000+ signalized intersections across the U.S. at a vastly lower cost than installing and maintaining traditional system sensors
READ FULL ANNOUNCEMENTLearn how Washington County used Signal Analytics to provide immediate congestion relief in this case study.
READ CASE STUDYWatch this on-demand webinar to find out how you can analyze signal performance across entire networks—without the need for costly hardware or time-intensive studies.
Watch Now