


By Rick Schuman, VP, Public Sector Americas (rick@inrix.com)
This is the second edition of a weekly review of changes in road traffic demand in the United States from the COVID-19 virus spread and our collective response.[1] We will endeavor to publish this Synopsis every Monday for the foreseeable future, providing results through Friday of the previous week. For those interested in detailed information with daily updates, we have introduced the INRIX Traffic Volume Trends Dashboard.
Key Findings
- Overall travel down 38% for the week, compared to 18% last week, dropping 40% by Friday
- When compared to typical daily travel:[2]
- Nationally, personal travel dropped consistently during the work week from 38% to 44%
- Long haul truck travel showed first signs of decline by end of week, down 20% on Friday
- Local area commercial travel was on a steady decline throughout the week, reaching 16%
- San Francisco and Detroit’s personal travel have both dropped by nearly two-thirds overall
- Michigan has largest personal (56%) AND long-haul truck (41%) travel drop statewide, Friday
- How bad can it get?
- Spain now has the largest traffic drop in Europe, with passenger travel down 80% and commercial travel down 40%
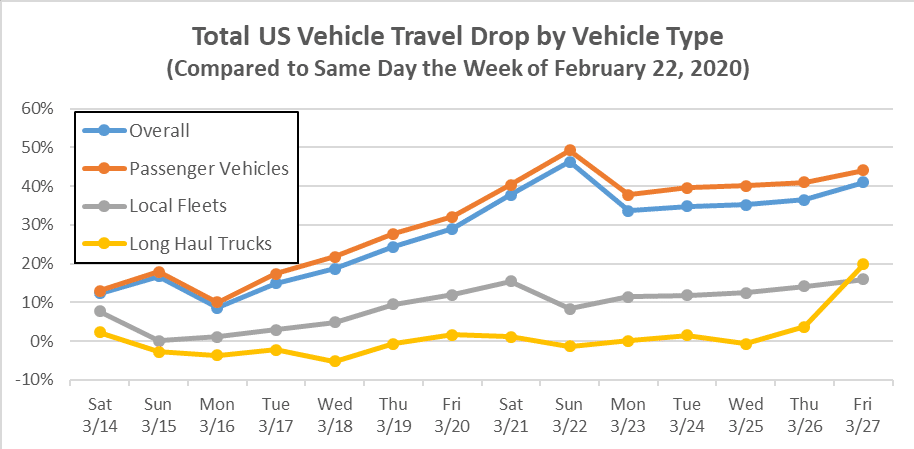
Figure 1
Background
Our incoming data sources (The ‘INRIX Fleet’) – providing anonymous speed/location reporting to us in real-time – generate over 100 million trips traveling over a billion total miles per day in the US across consumers, local fleets, and long haul trucks. We use this data to create a myriad of real-time and near real-time services, and this data network gives us a unique and timely window into the nation’s roadway travel. Our data sources span the full range of vehicle types using the national network and provides information about all roads in the network, not just major roads.
In addition to our real-time speed and congestion information, much of which is being used by the media to document the impact of the virus on travel, our trip data can serve as a proxy for overall road usage trends at national, state and local levels. In this extraordinary time, we have re-purposed our INRIX Trips metadata to generate relevant summary level information about traffic demand.[3] Below documents what we have seen thus far, with Figure 1 providing the national summary.
With only a 48-hour lag, we hope that this information will be useful to policy makers and the public. And we too look forward to the week, hopefully soon, when we can report on congestion and volume growth – as this will be a sure sign of recovery.
Synopsis
In Issue #1 last week, we pointed to Friday March 13th as the day when travel patterns began to change. After a week of consistent declines March 14 – 20, we have had a further drop this week of March 21 – 27 in overall travel. The drop was primarily driven by passenger vehicles and local fleets, that is until late in the week when long haul truck traffic first saw noticeable declines as well. Figure 1 shows the daily percentage drop in total miles traveled nationwide by the INRIX Fleet, by vehicle type. Table 1 provides a comparison of the average drop this week versus last week from typical.
| Vehicle Type | Week Beginning 3/14 | Week Beginning 3/21 |
| Overall | Down 18% | Down 38% |
| Personal Vehicles | Down 20% | Down 42% |
| Local Fleets | Down 5% | Down 14% |
| Long Haul Trucks | Up 2% | Down 3% |
Table 1 – Comparison of Last Two Weeks of Travel versus Typical, Nationwide
As with last week, the decline in national passenger traffic volume is directly tied to a decline in total trips. Trip distance last week averaged 9.1 miles, compared to 9.4 miles the previous week and 9.2 miles typical. With the reduction in congestion as reported by INRIX Research in an updated blog post this week, trip times held steady at 17.8 minutes, same as last week and compared to 18.5 minutes per trip typically.
How bad could it get? Last week, we focused on Italy, the first country establish nationwide restrictions. While Italy continued to see declines in travel across all vehicle types, Spain has surpassed Italy with the largest drop in total travel. For the week, Spain’s nationwide passenger vehicle travel was down 80% and commercial vehicle travel was down 40%.
Overall travel drops are now significant in every state. By Wednesday, every state had at least a 10% drop in overall travel. Wyoming was the last holdout as of Tuesday, but that changed by Wednesday. Table 2 lists the reduction in overall travel in the ten largest states the last two Friday’s as compared to typical levels. Note every state was down this Friday from the previous Friday.
| State | Initial Drop Date | Severe Drop Date | % Drop March 20 | % Drop March 27 |
| California | March 10th | March 14th | 37% | 42% |
| Texas | March 13th | March 14th | 30% | 36% |
| Florida | March 14th | March 15th | 25% | 39% |
| New York | March 12th | March 13th | 36% | 39% |
| Pennsylvania | March 13th | March 14th | 31% | 38% |
| Illinois | March 11th | March 14th | 27% | 40% |
| Ohio | March 12th | March 14th | 28% | 45% |
| Georgia | NA | March 14th | 23% | 30% |
| North Carolina | March 13th | March 14th | 22% | 31% |
| Michigan | March 12th | March 14th | 36% | 55% |
| Nationwide | March 13th | March 14th | 30% | 41% |
Table 2 – Largest 10 States, Overall Travel Decline Details
Figure 2 shows a single day snapshot on Tuesday how the changes in travel for passengers and trucks varied by state. States with the largest drops in passenger traffic are logically those that had travel restrictions in place by Tuesday. The states with the largest drops in truck travel are tied to the auto industry and/or border Canada, which was closed to non-essential traffic early last week.

Figure 2 – State by State Comparison of Passenger and Long Haul Truck Travel (US Total in Red)
Table 3 lists the reduction in overall travel in the ten largest metropolitan areas, plus the hard hit areas of San Francisco, Seattle, New Orleans, and Detroit) the last two Friday’s as compared to typical levels. Note every area was down this Friday from the previous Friday.
| Metropolitan Area | Initial Drop Date | Severe Drop Date | % Drop March 20 | % Drop March 27 |
| New York | March 13th | March 14th | 43% | 48% |
| Los Angeles | March 12th | March 13th | 37% | 45% |
| Chicago | March 10th | March 13th | 32% | 44% |
| Dallas-Ft. Worth | March 12th | March 14th | 35% | 45% |
| Houston | March 13th | March 13th | 33% | 40% |
| Washington, DC | March 12th | March 14th | 36% | 41% |
| Miami | March 12th | March 14th | 36% | 48% |
| Philadelphia | March 12th | March 14th | 39% | 48% |
| Atlanta | March 13th | March 14th | 28% | 34% |
| Boston | March 12th | March 13th | 39% | 41% |
| San Francisco | March 6th | March 12th | 51% | 54% |
| Seattle | March 3rd | March 5th | 29% | 53% |
| New Orleans | March 13th | March 14th | 37% | 42% |
| Detroit | March 12th | March 14th | 40% | 62% |
| Nationwide | March 13th | March 14th | 30% | 41% |
Table 3 – Largest and Key Metropolitan Areas, Overall Travel Decline Details
In figure 3, we have added New Orleans and Detroit to our day-to-day metropolitan area level analysis this week, as both have had significant virus case growth. Detroit has had a consistent 60%+ drop in overall traffic volume most of the work week.

Figure 3
[1] The first issue published March 23rd can be found here
[2] Given the day of week pattern of travel demand, we compare a given day and area to the same day/area in a previous week, and we are using the week commencing Saturday, February 22, 2020 as our typical week
[3] Metadata used is total trip distance of all INRIX Trips originating in the country/state/region each day